IELTS essay question
The chart below gives information about how families in one country spent their weekly income in 1968 and in 2018. (Source: Cambridge 17)

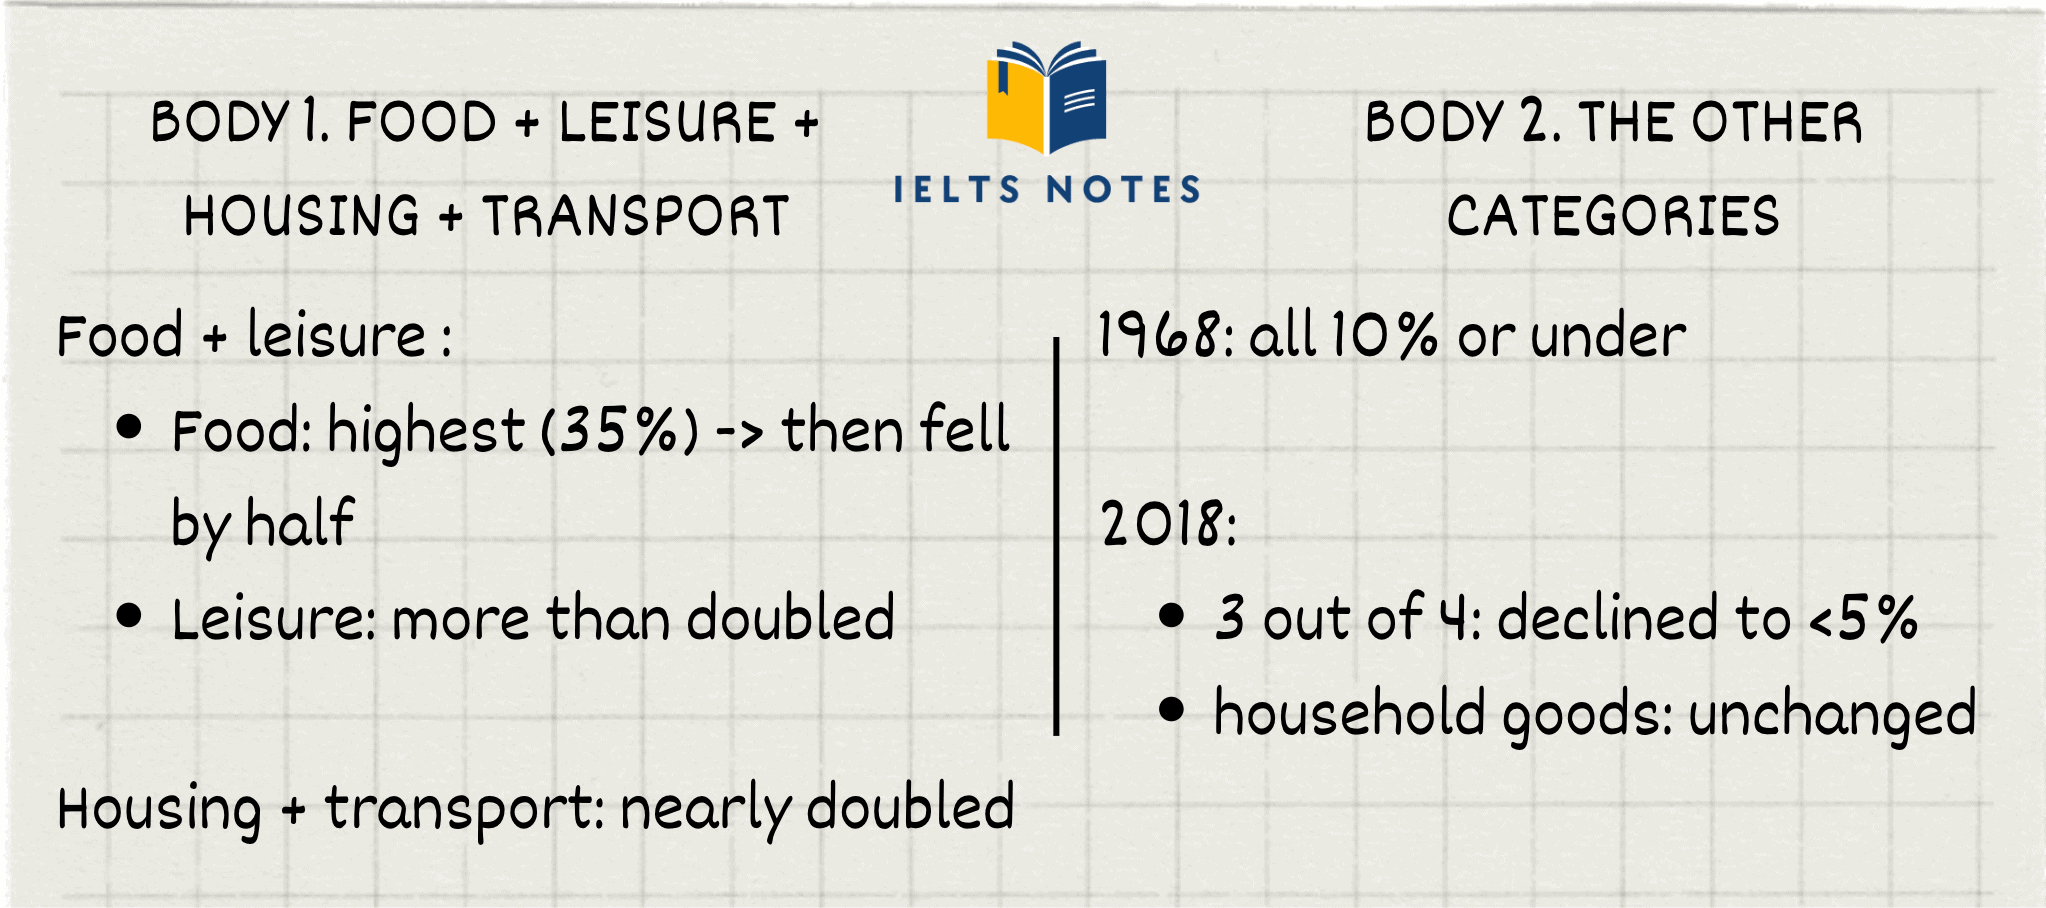
Plan your answer
Sample answer
The bar chart compares the proportion of spending per week on eight different categories by the average family in an unnamed country between 1968 and 2018. Overall, while expenditure on leisure activities, housing, and transportation increased, the opposite was true for the other categories, with the exception of household goods, which remained unchanged during the period given.
In 1968, food accounted for the highest proportion of total spending, with more than a third of the family budget spent on this per week, but it fell by half in 2018. By contrast, spending on leisure activities experienced significant growth, with figures more than doubling to around 22% in 2018. Expenditure on housing and transportation also nearly doubled to around 20% and 15%, respectively.
In 1968, the four other categories constituted 10% or under of the family budget, among which spending on three out of four witnessed a decline to less than 5% in 2018; only expenditure on household goods remained stable at around 8% of the total budget in both years surveyed.
Useful vocabulary
- category (n) = a group of things
- expenditure on something (n) = spending on something
- exception = a thing that does not follow a rule
- budget = money
- double (v) = to become, or make something become, twice as much or as many
- witnessed a decline = decreased