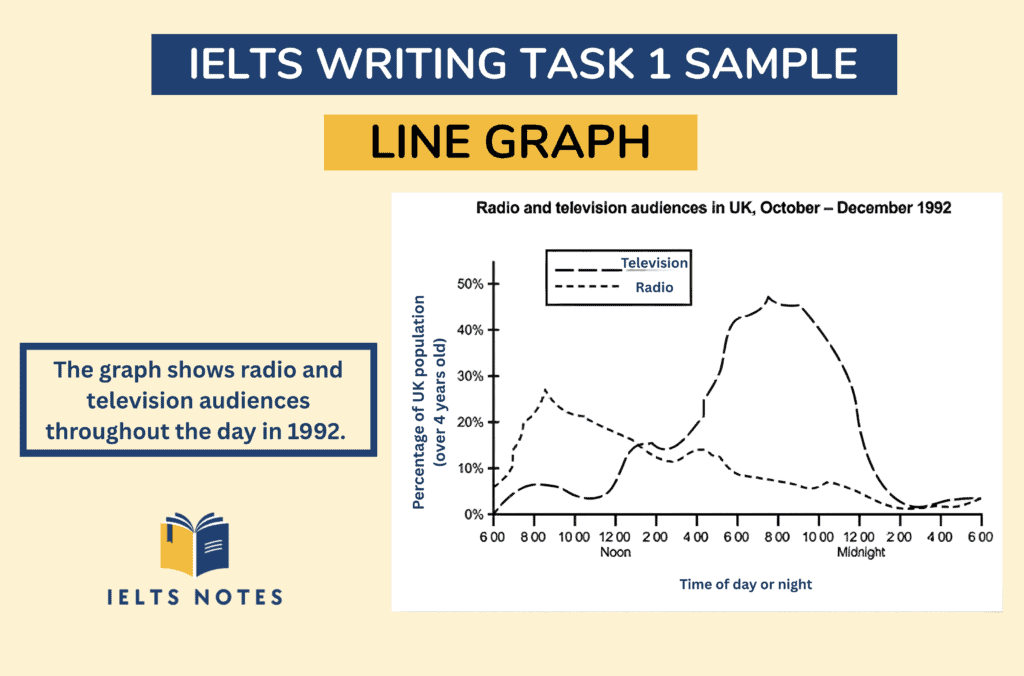
The graph shows radio and television audiences throughout the day in 1992.
Introduction
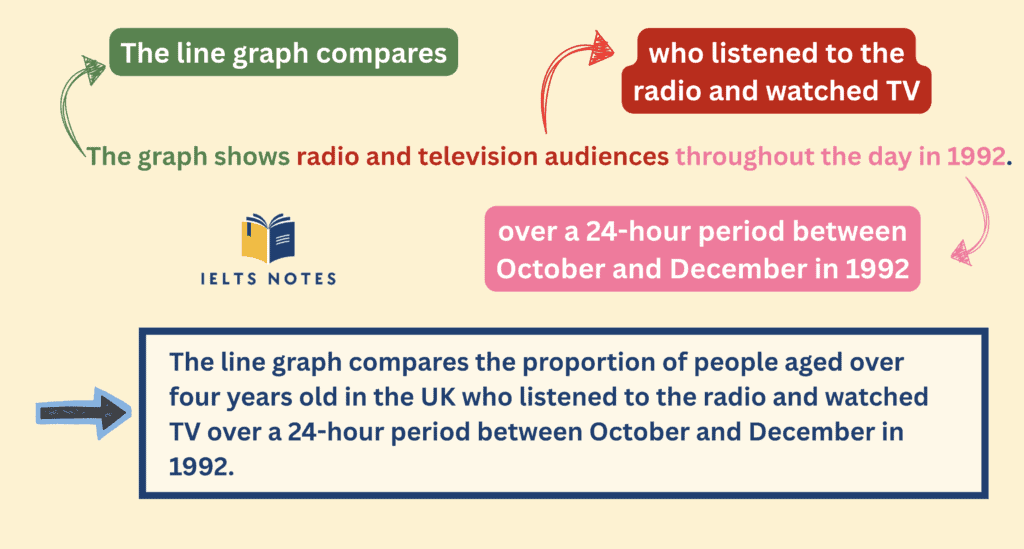
For the introduction, you only need to paraphrase the task question.
Read more
Overview
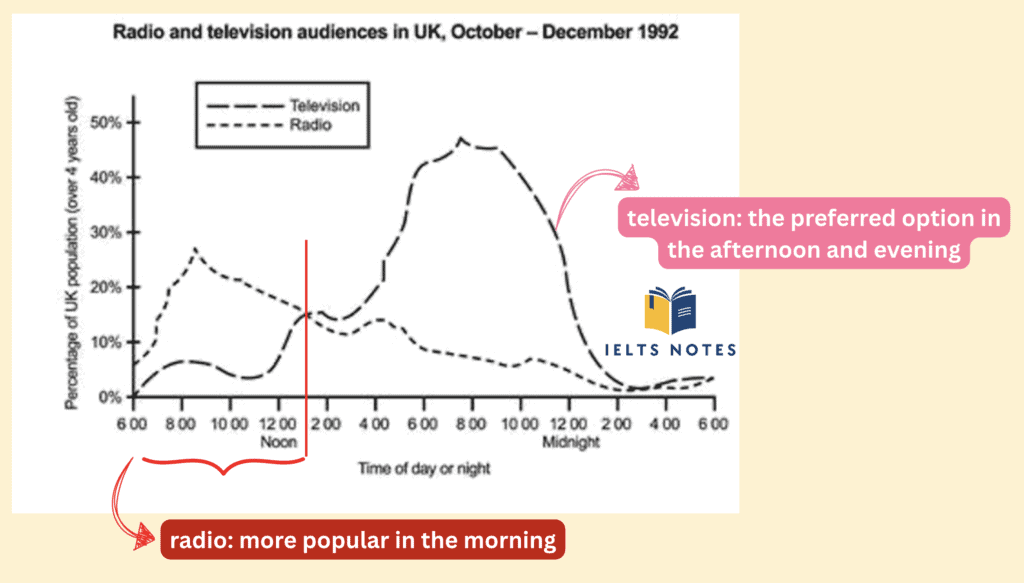
→ Overview:
Overall, radio was more popular in the morning, while TV was the preferred option in the afternoon and evening.
Plan your answer
Read more
Sample Answer
The line graph compares the proportion of people aged over four years old in the UK who listened to the radio and watched TV over a 24-hour period between October and December in 1992. Overall, radio was more popular in the morning, while TV was the preferred option in the afternoon and evening.
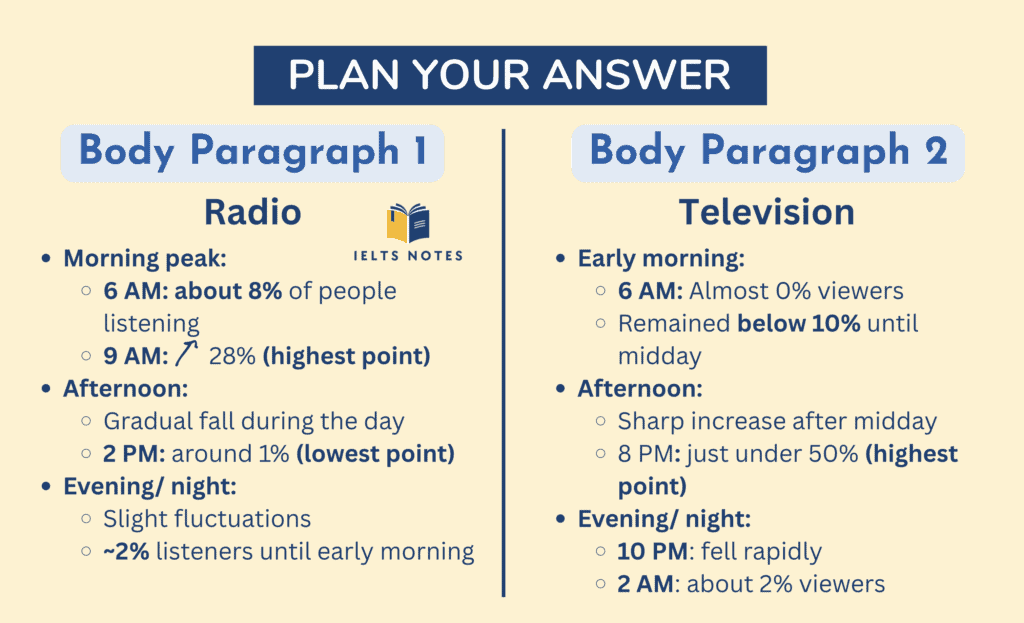
Looking first at the radio category, at 6 AM nearly 8% of the population were radio listeners. This number then climbed quickly to around 28% by 9 AM, the highest figure throughout the day. From this point though, it started to decline progressively to a low of just 1% at 2 PM and fluctuated around 2% until early morning.
TV followed a different pattern. Almost no one watched TV at 6 AM, and the percentage of TV viewers kept below 10% until midday. From this time onwards, however, the figures increased sharply, reaching a peak of just under 50% by 8 PM. From 10 PM, it started to decrease dramatically until 2 AM when only around 2% were watching TV.
Useful Vocabulary
- the preferred option = the choice that people like more or choose more often compared with other alternatives
- the highest figure = the maximum value recorded in the data
- decline progressively = decrease gradually over time
- a low of = the lowest recorded value in a period
- keep below = remain lower than a specific number
- reach a peak of = rise to the highest point
- follow a different pattern = show a different trend compared to another category